KPI Dashboard

« Back to Glossary Index

What is a KPI Dashboard

What is a KPI Dashboard?

The so-called Key Performance Indicators (KPIs) are the most important business metrics for your company. They provide important ways to determine how your business is performing and help you measure whether you are on track to meet those goals. A KPIDashboard goes one step further by bringing all your KPIs together in one place. You can thus see how each individual measurement is performing side by side and thus evaluate the entire performance framework.

Why a KPI dashboard might make sense for you.

So far, so good. But of course, no metric works in isolation from each other. Your KPIs overlap and influence each other. When you plot them side by side, you can immediately see which goals were achieved at the expense of other metrics. You can start looking at the Dashboard so start experimenting with adjusting goals and policies to be more effective overall.

Typically, companies also divide their KPIs into "high-level" and "low-level" KPIs, i.e. primary and secondary. These are the big, overarching goals of the company and narrower, departmental or individual goals.

The great thing about this is when these are on a Dashboard are laid out, you can see how the smaller goals transition into the larger ones. You'll get an instant snapshot of what areas are in the target range and how that impacts the overall performance of the business. This, in turn, can help you determine where problem areas are forming. You'll also gain insights that will help you improve your goals and business strategies to achieve high-level KPIs.

For example, let's say your company wants to increase its annual profit by 15%. Meanwhile, you have told your sales team that they are expected to achieve, say, 40 sales of a new product per month.

Most of your employees are hitting their goals, but profits are stagnant. If you look at your KPI-Dashboard and look at your KPI tracking, you see that renewal rates are dropping and impacting your profits. So now you know that your team is too focused on new sales at the expense of maintaining relationships with existing customers. So now you can adjust KPIs to optimize both securing renewals and attracting new customers.

What does a KPI dashboard look like?

Depending on the type of Dashboard-software, you can integrate a variety of KPIs, from net profit, revenue growth, and churn rate to how well you're delivering projects on time and on budget, how much revenue you're generating per customer, or how much you're spending to onboard each new customer.

You can use your Dashboard also adapt to the position of the user. For example, the KPI-Dashboard of your CEO may be structured quite differently than that of an IT project manager or a marketing manager, depending on the insights most relevant to their role.

« Back to Glossary Index

FAQ

What is a KPI dashboard? arrow icon in accordion
A KPI (Key Performance Indicator) dashboard is a data visualization tool that helps users track and analyze key metrics. With a KPI dashboard, users can view relevant metrics and monitor their performance against previous periods.
Why should I use a KPI dashboard? arrow icon in accordion
A KPI dashboard can help businesses achieve their goals and results by displaying performance. It can also help enable better decision making by increasing business visibility. In addition, it can visualize data in a simple and intuitive way to help users spot trends and variances they might otherwise miss.
What are the main features of a KPI dashboard? arrow icon in accordion
A KPI dashboard scales, aggregates, and visualizes data in real time, enabling rapid adaptation to changing requirements. It can generate quick and easy reports on various business metrics. It can also enable users to integrate relevant data with multiple data sources for better analysis of business performance.
What are the types of KPI dashboards? arrow icon in accordion
There are three main types of KPI dashboards: real-time dashboards, which display company data in real time; time-series dashboards, which visualize data over longer periods of time to identify trends; and multidimensional dashboards, which display data from multiple sources to enable complex analysis.
Is it difficult to set up a KPI dashboard? arrow icon in accordion
No, it is not difficult to set up a KPI dashboard. Basically, users just need to specify the required data sources and select the desired KPI metrics to create the dashboard. Some KPI dashboard tools also offer pre-built KPI templates that can help users get started quickly.
What are the best tools to create a KPI dashboard? arrow icon in accordion
There are many good tools on the market that can be used to create KPI dashboards. Some of the most popular tools are Tableau, Power BI, Google Data Studio and Domo.
What are the best practices for creating a KPI dashboard? arrow icon in accordion
Best practices for creating a KPI dashboard include choosing the right data sources, considering relevant metrics, creating a clear layout, and using colors and graphics to make the data easy to understand and intuitive.
Can I create multiple KPI dashboards? arrow icon in accordion
Yes, you can create multiple KPI dashboards. With most KPI dashboard tools you can create different dashboards for different purposes, e.g. a dashboard for financial data, a dashboard for production data, etc.
What data sources can I connect to a KPI dashboard? arrow icon in accordion
You can connect data from multiple sources to a KPI dashboard, including ERP systems, databases, spreadsheets, social media platforms, and cloud-based services.
Can I share my KPI dashboard with other users? arrow icon in accordion
Yes, you can share your KPI dashboard with other users. Most KPI dashboard tools provide dashboard sharing features that allow users to send dashboards to other users or share them publicly.

With top positions to the new sales channel.

Let Google work for you, because visitors become customers.

About the author

Social Media & Links:

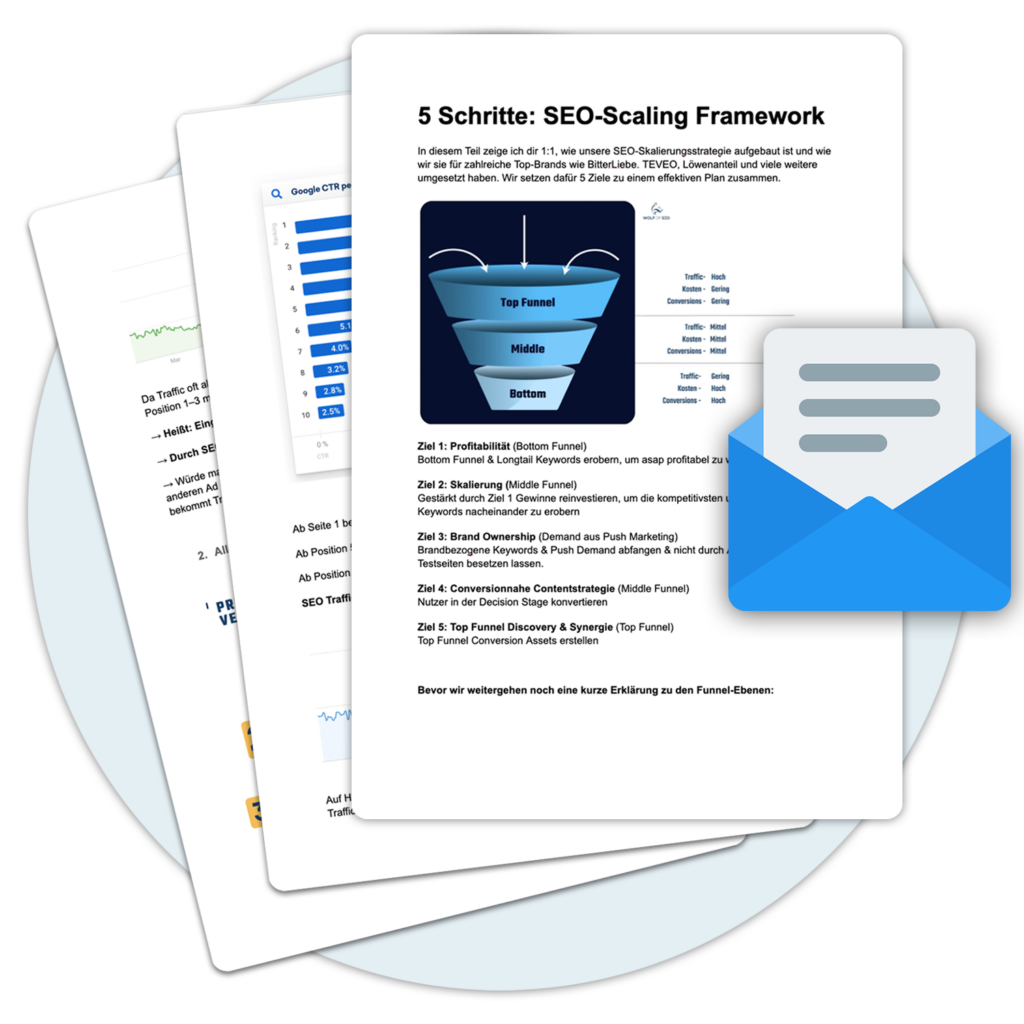
SEO Scaling Framework

The fastest way to the SEO revenue channel

✅ Our exact framework condensed into 96 pages

✅ 3 hours of detailed accompanying video with additional best practices

✅ Step-by-step path to the Bulletproof 100k€ SEO channel

Request video + PDF now!

ℹ️ We will check your details and then release the PDF:

🔒 Don't worry! We will No spam e-mails send!