Was sind bei Google Analytics the Top10 reports for beginners. Our Ranking shows which reports most people consider important. Visits, page views, pages/visit, bounce rate, visit time and new visits are specified by Google. The users of Google Analytics but may see it differently and find their own order.
Google Analytics for beginners: 8 reports
Our readers have very different objectives, so it is difficult to mention the right reports for each individual. Of course, there is no one-size-fits-all solution. However, there are basic things that every beginner wants to see. First of all, this is about Traffic, because Traffic is the basis for success. We also focus on finding the right Traffic to be presented. The various modules are presented below.
If you want to add a new report as a graphic, go to the left-hand side of Google-Analytics on the corresponding report and then adds it to the top left with the button: "Go to Dashboard Add" to the graphical overview.
Page views
Seitenaufrufe oder Pageviews sind bei Google Analytics vielleicht ein wenig schwammig definiert. In der deutschen Werbebranche handelt man mit „Impressions“, was bedeutet, dass eine Internetseite von Anfang bis Ende geladenwurde, d.h. mit allen Grafiken und sonstigen Elementen. Der Seitenaufruf wird nicht genauso definiert und kann demzufolge als Seitenaufruf dargestellt werden, ohne dass die Seite vollständig geladen wurde.
Page views are initially the largest number in our overall report. That's why we put it at number one. Later, it also becomes important how many pages a visitor sees. So we already have the basis here.
The report can be found at: Target Group Overview
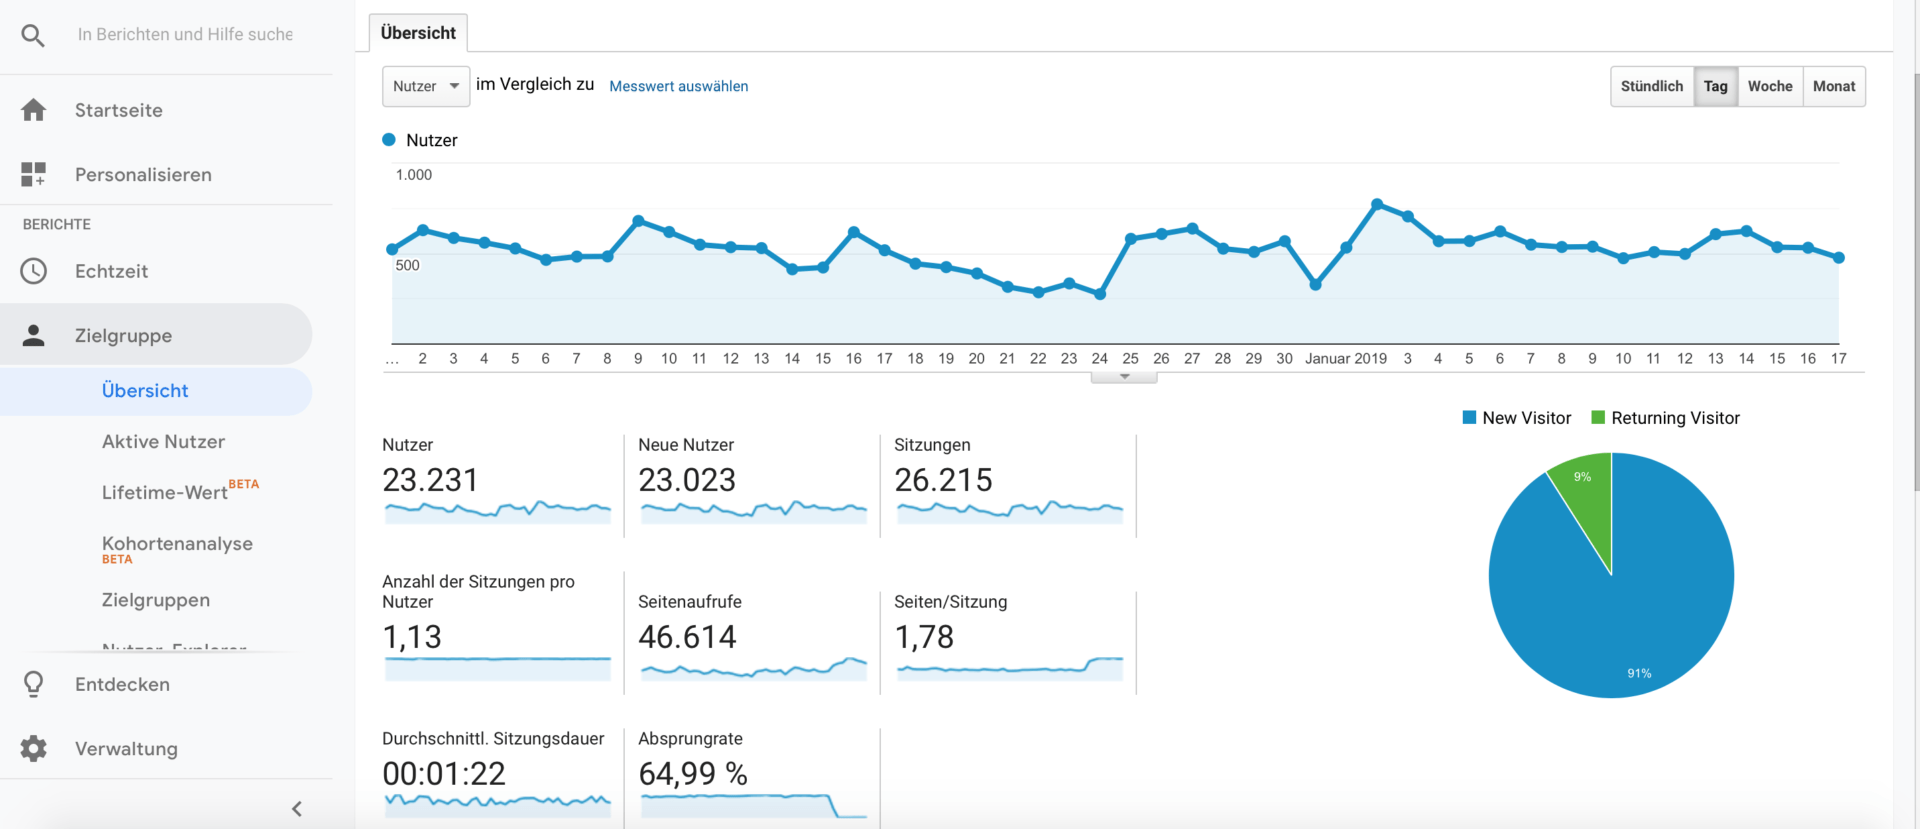
Users
Google Analytics distinguishes between page views (=visits) and users (=visitors). A visitor can make several visits. That is, under page views you have the larger number. A visit is estimated by most tools between 5-10 minutes. After that, the same visitor starts a new visit. So the more reliable figure is the user . Therefore, we want to focus here from the outset on the user (also called unique user).
The report can be found at: Target Group Overview
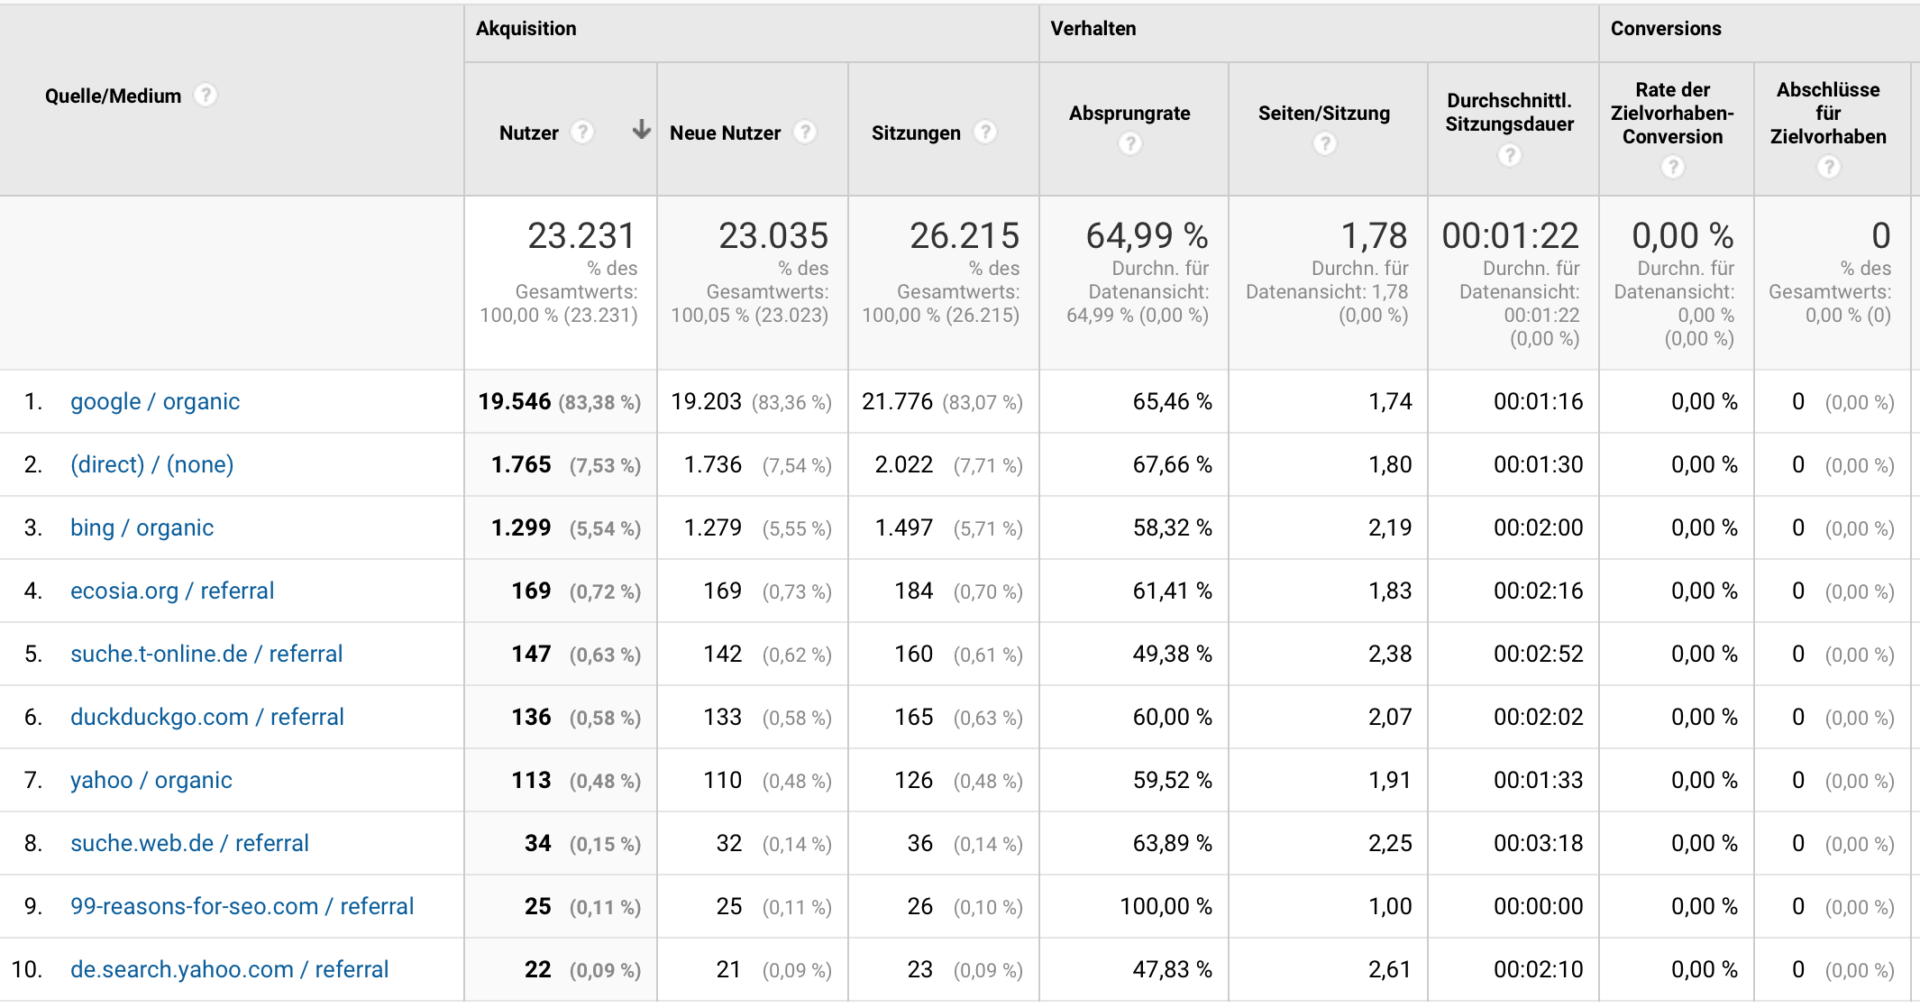
Access sources
In the access sources you can see from which other website the users were referred to us. Here, the source or medium is shown and the visits that were initiated from there. Since Google has a search engine market share in Germany of about 93%, there will be accordingly many visits from there. You can also see well in this statistic, which friendly or linked pages Traffic cause.
The report can be found at: Acquisition/All Accesses /Source & Medium
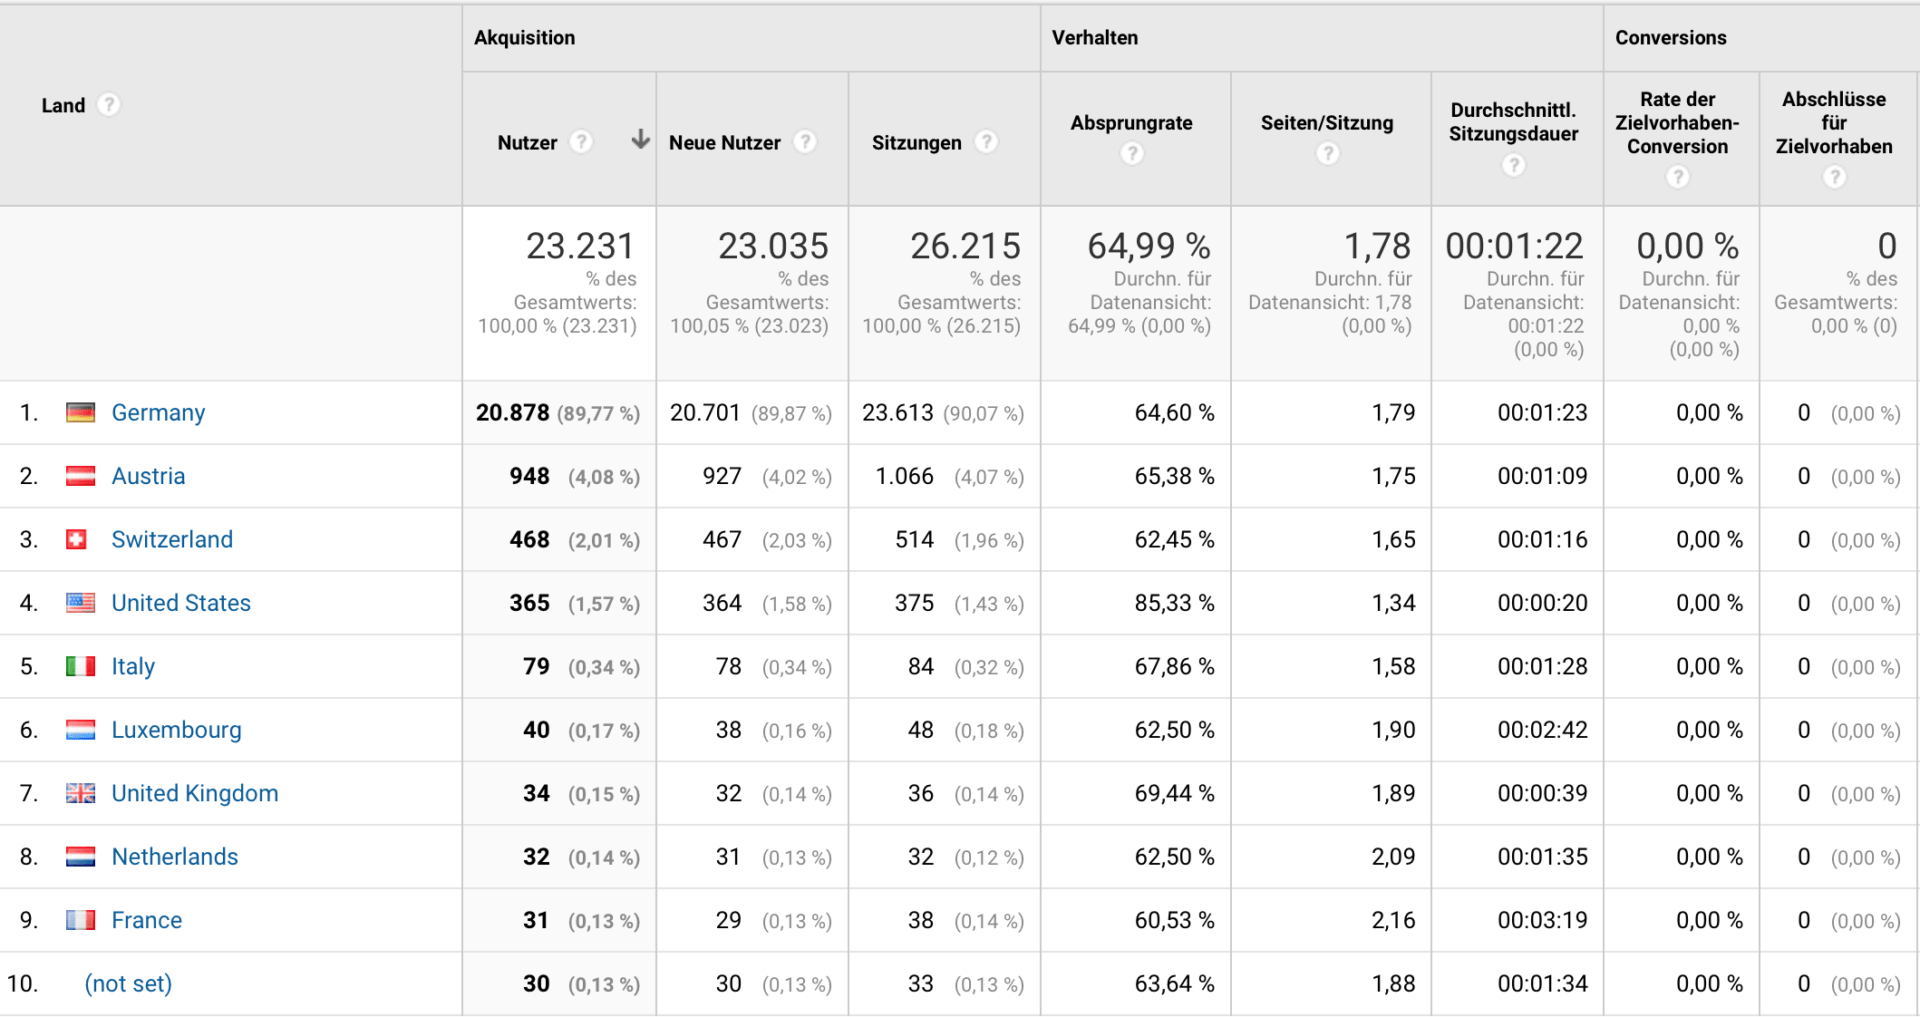
Target countries
Here we can find out where our visitors come from. We can also click on neighboring countries. Of course you only select Germany if you want to concentrate on this market. Otherwise, you can also choose any other region or city.
The report can be found at: Target group/Geography/Country
Most popular websites
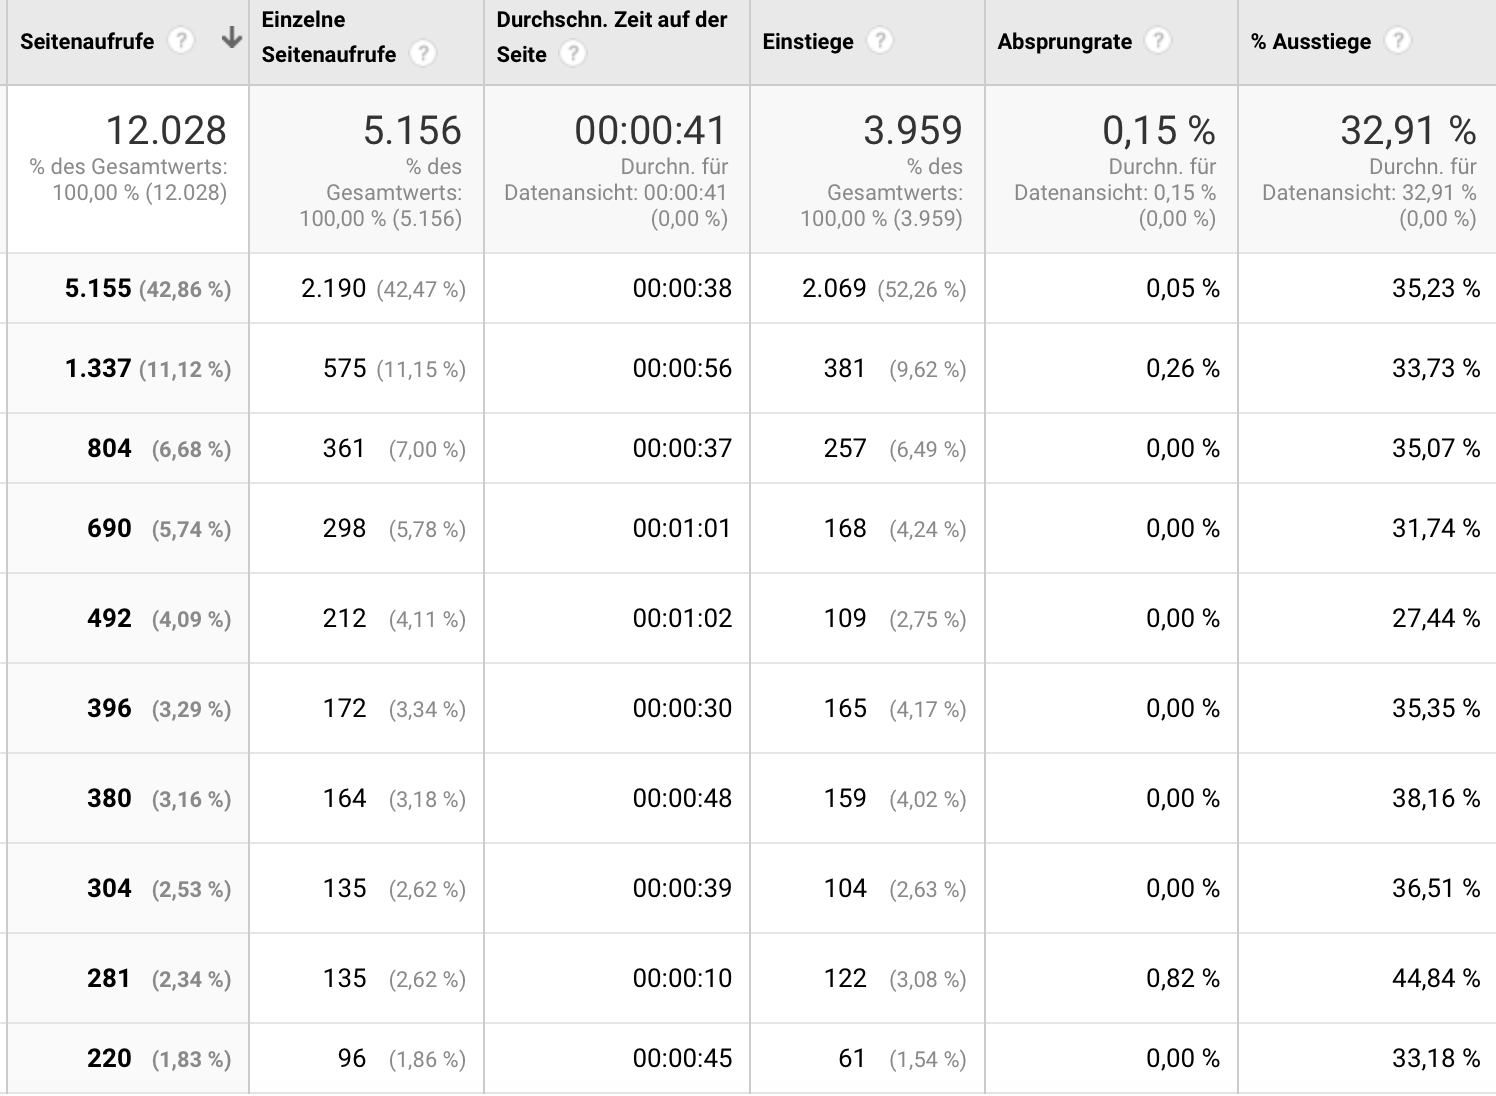
The most popular websites are the pages that visitors have visited most frequently. Here we find out which of our articles or pages were best received by visitors. We can then consider which topics we want to cover in more depth or which topics are still missing. The page with this symbol: / is the homepage or Index-page, i.e. the page you see when you just enter the domain or are referred to it.
The report can be found at: Target group overview/Websitecontent/All pages.
Most popular landing pages
Target pages are the pages that are called up first by users. These can be the home page, but also directly each article or any other page, i.e. the entry pages.
The report can be found at: Behavior/Behavior Flow

Keywords
Keywords are the words that visitors search for in the Search Engine to get to our landing page. Only with more Traffic these keywords also have a good informative value.
The report can be found at: Access Sources/Keywords
Most frequent exit pages
If you know where the visitor leaves the site, you know where to start to keep the visitor coming back.
The report can be found at: Wbsitecontent/ exit pages
What are your top reports on Google Analytics?


